Seeding a smart city
Turning urban rooftops into climate data generators
There’s always a strange disconnect with the calendar if you live in Northern California and look out your windows between June-August — a habitual 3pm fog bank settles into its summer routine and persistent winds make for an unusually cold few months. Now in September, it’s finally summer.
There are fewer consequences to cool, blustery weather compared to the bone dry and overheated remainder of the state, so it often feels like living in a freezing bubble surrounded by molten lava. You might say it was the perfect environs for contemplating climate change and working on DirtSat.
____
Back to regular smart city programming…
In previous posts, I walked through some of the ways geospatial intelligence and IoT can supercharge productivity and sustainability in urban agriculture. Both of these technologies provide ample coverage for monitoring crops, micro-climate, and a host of other climate mitigation data points. But the sheer volume of data collected by a suite of IoT devices or a single satellite is difficult to comprehend and act on.
Smart city initiatives harness an immense index of information and use it to quantify a wide array of climate project impacts.
To give you a sense of data volume, a CubeSat (3U satellite) can produce up to 100+ terabytes (TB) per day. 1TB is equal to roughly 1,000 gigabytes (GB). For reference, many portable external hard drives hold between 500GB to 2TB of data, while basic factory installed memory on most computers runs around 8-32GB.
With hundreds to thousands of these small satellites (including constellations) orbiting at any particular time, the data can exceed thousands of TB per day.
Global IoT data is measured in zettabytes (ZB). 1ZB is a unit equal to one trillion GB. By 2025, roughly 41 billion IoT devices are projected to generate 79 zettabytes of data.
With all this information, how do you extract valuable data from the generic bits in the most efficient manner?
____
It’s called big data for a reason
Adjusting the firehose of information (both in terms of volume and velocity) created by these sources is key to creating value from them. Not only that, but this is also notoriously “noisy” data, which means it needs to move through an ETL/ELT (extract/transform/load) architecture before it’s ready for analysis - for simplicity sake I’m going to say it’s analogous to building out a rare book exhibit at the Library of Congress from scratch.
Imagine searching a significant library’s basement and finding immense piles of priceless books, in no particular order and hidden beneath drop cloths. You first need to remove the cloth, so that you can discover the titles and note what kind of subject matter is addressed within. You then need to create a system for categorizing and displaying the titles (not unlike the trusty old Dewey decimal system), which will also allow you to easily locate items for future reading (querying).
These categories might be based on similar subjects, same author, date penned, or city or region where the action takes place. It’s one big happy relational database. Like IoT or geospatial data, once the information is cleaned up (smoothed) and stored, it’s available for deeper analysis.
____
What kind of sprinkles would you like with your AI?
Now that we’ve got our collection duly categorized, we can begin culling titles by topic and analyzing trends or patterns. Data is no different, except we’re using deep learning models to make the process of discovery more accurate and much much faster. Both IoT and geospatial data require a substantial amount of machine learning capability to parse through the high volume of collected information and deliver key insights.
Let me take a step back. The term AI is thrown around with impunity today, but the differences between AI, machine learning, deep learning, and neural networks may not be clearly differentiated in casual conversations. As depicted in the Russian nesting doll analogy above,
“…machine learning is a subfield of artificial intelligence. Deep learning is a subfield of machine learning, and neural networks make up the backbone of deep learning algorithms. “ IBM
This represents a basic framework for AI. As you move from left to right on the image above, you’re drilling down deeper or applying more depth of analysis through added layers. The deep learning models can ingest a lot of data, and largely without humans interceding in the process (unsupervised learning). This is where maximum efficiencies are pursued and time sensitive discoveries are surfaced with ease.
____
The past informs the future
Smart cities incorporate real-time data from a variety of inputs, including IoT-enabled devices and geospatial data. This stream of big data is captured, managed and analyzed via an Information and Communication Technologies (ICT) infrastructure. Similar to geospatial data, the usefulness of the inputs is highly dependent upon breadth and cadence (time between data capture).
As current data architectures adapt to the necessities of real-time data capture and the speed with which prediction is critical in the smart city ecosystem, it’s still important to remember the immense value of historical data. Day after day, month after month, as historical data grows, the more useful it becomes. Here is where predictions, patterns, and long term strategies take root, and where deep learning and neural networks work their magic.
Neural networks are a type of machine learning that loosely resembles the neural pathways we use in our brains. On a basic level you have multiple inputs that are processed within a layered computational framework and produce a series of outputs.
Neural networks can be particularly useful in developing feature extraction (keeping the relevant information and discarding the rest) and image segmentation (dividing an image into meaningful parts) from geospatial imagery. This might include targeting building footprints, trees, or roads.
Satellites capture 1000s TBs of optical imagery per day, covering wide swaths of land cover. If we’re looking for specific features or clues to guide decisions, finding a way to recognize them across many different images with high accuracy is essential.
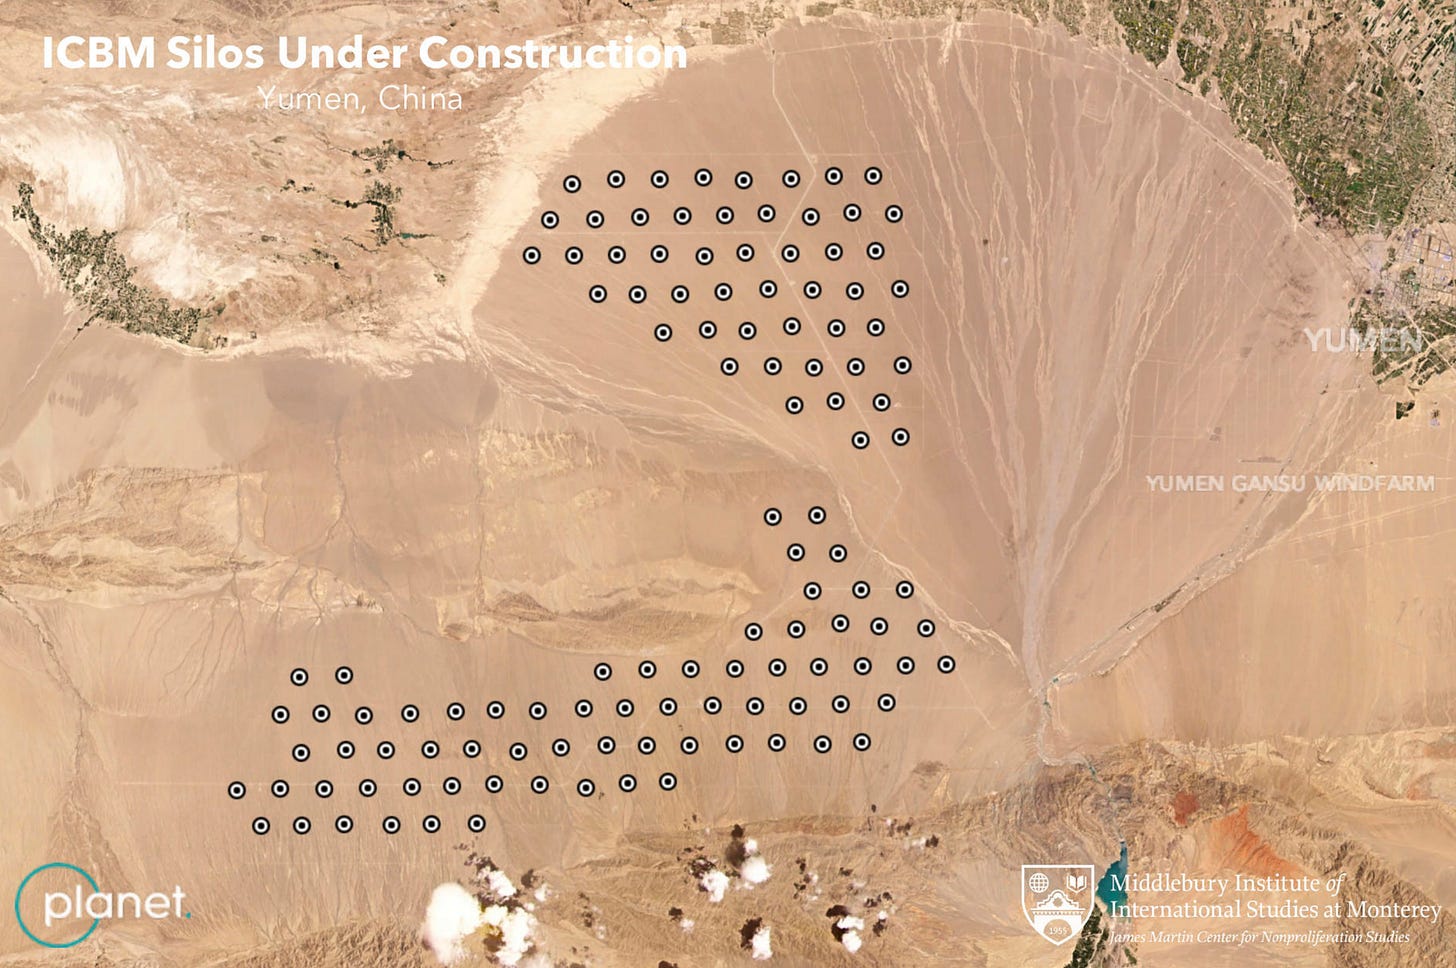
Recent press surrounding the potential identification of 110 new missile silos in a remote Chinese desert (identified through geospatial data) is perhaps an extreme example. Feature extraction and image segmentation are responsible for the identification.
Features may point toward the outline/shape of a missile silo, or reveal land change features in the surrounding area that indicate a build up of key infrastructure to support certain activities - fuel depots, new roads, barracks, etc. In the Planet image, the geometric precision of the features against a natural landscape might be enough to signal something worthy of further review.
____
Smart city infrastructure
Feature extraction in smart cities allows environmental health to be measured and monitored remotely. Tree canopies can be identified, building to green space ratios can be maintained, and urban agriculture can be tracked. As well, viable opportunities for further green development can be identified and deployed.
Smart city data analytics uses inputs to predict trends, spot emerging parallels, and modify behaviors in order to deliver seamless services and increase mobility and reliability for citizens. IoT is considered an increasingly efficient means of shaping sustainable growth in cities, where systems and green space can coexist and co-inform the health of the city.
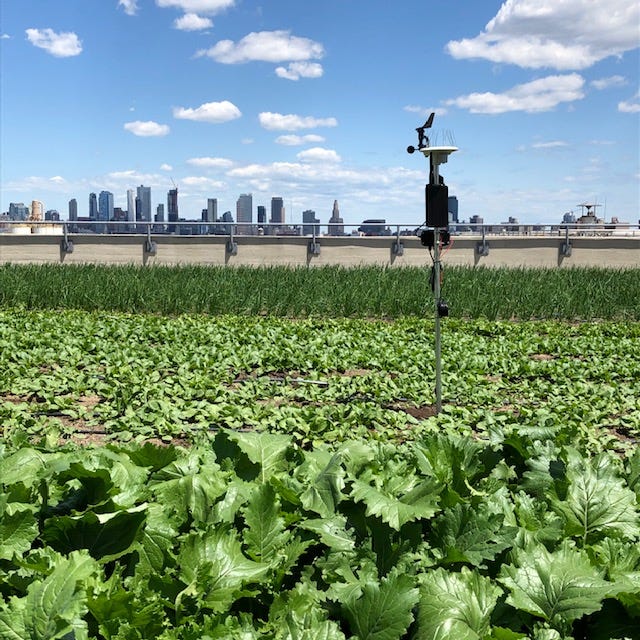
Much like seeding a field, thousands of IoT sensors have been ‘planted,’ becoming the eyes and ears of smart cities.
Developing a robust digital infrastructure to ingest and apply analytics algorithms is vital to extracting useful information. Visibility, across departments or across sectors, is crucial to identifying the most relevant and impactful use cases. The interconnectivity enables cities to fully leverage all of their assets and capabilities.
The key to the success of smart city deployments, is the idea of interoperability, or communication within and between disparate segments / verticals.
That’s where significant value can be extracted and put to use benefitting a much wider segment of the population. Much like geospatial intelligence, understanding how different systems interact and affect one another can unlock game changing ingenuity.
Drawing parallels between green infrastructure and economics is important for cities to understand. Measuring the change in air temperature around three new green infrastructure projects and correlating an increase in pedestrian traffic and concurrent economic spending in the surrounding areas during warmer months, can spur the city to invest further in projects that benefit these local communities.
DirtSat Progress Report
By applying neural networks and deep learning, our team is developing a key piece of DirtSat’s infrastructure index technology. Through a series of algorithms, our index is enabling the detection and ranking of rooftops, across any city, for agriculture implementation. Providing cities with a roadmap of viable infrastructure assets, the index also cross-references a host of socio-economic and climate specific indicators, to ensure the holistic development of the rooftop farm network.
We can help illuminate where to build and why to build there, so that the most susceptible neighborhoods (to food deserts and climate pressures) are targeted first. Once operational, the daily metrics we provide for each rooftop project feeds into an anonymized and aggregated data platform, enabling visibility and actionable information across the entire smart city ecosystem.
While it may seem like urban food production is hogging the limelight, a network of urban farms can mitigate five major climate resilience goals:
Reduced heat islands - >5°F
Reduced building energy consumption - 0.7 - 3% / yr per building
Stormwater capture - 75% retention during storm events
CO2 emissions avoidance - >451k - 1.3 million tons / yr per city
Restored ecosystem / pollinator habitat
Food security - 1/2 daily fruit & vegetable intake for 5.3 - 9.2M citizens across 50 cities (to start)
If there’s a major lesson to be learned from the space industry (on and off planet), it’s the adage, ‘do more with less’. A network of rooftop farms has the power to tick all of the above boxes.
Let’s build this together - one rooftop at a time.
Thanks for being here! Feel free to leave a comment or suggestion below - we love feedback. Follow us on Twitter at @DirtSatHQ and @CMTiballi


